
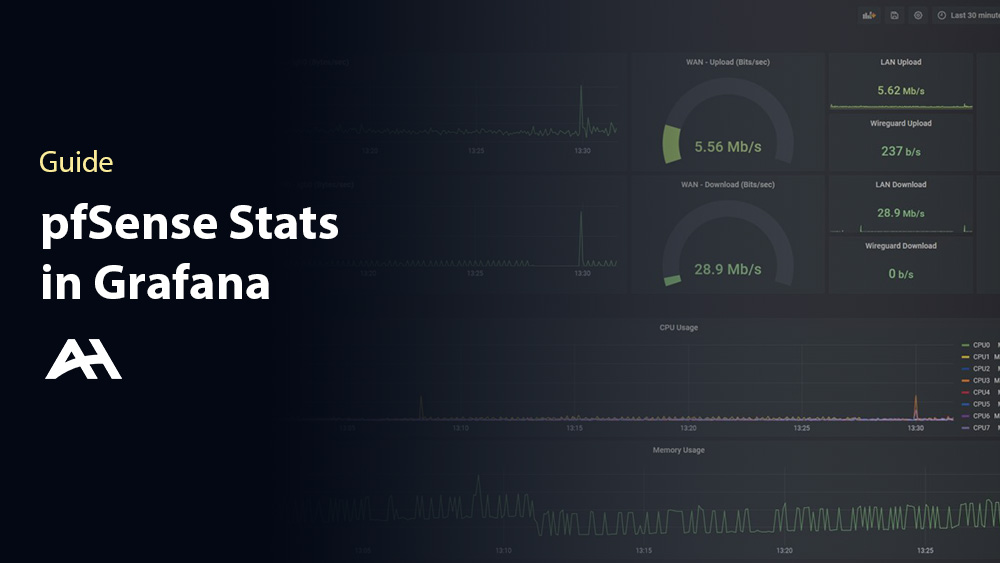
The pfSense web dashboard is a good enough solution for seeing brief statistics about your network. However, using Grafana to view this data instead of logging into the pfSense dashboard has a number of benefits including the ability to view historical trends and keeping your home network statistics all in one place.
Preface
This guide assumes you have also followed my introductory Grafana and InfluxDB setup guide which can be found here(ADD LINK). Once you have followed this guide through the “Installing Grafana and InfluxDB” section or have your own Grafana + InfluxDB setup, you can continue to this guide.
Installing and Configuring Telegraf on pfSense
For basic stats, we will be using the Telegraf package in the pfSense package manager. Head to System/Package Manager/Available Packages to install the package.

Then head to Services/Telegraf to configure the package.
The latest version of the pfSense Telegraf package does not support tokens in the web ui, which is how InfluxDB2 handles authentication. To solve this, do not select InfluxDB in the web ui, instead add this custom configuration to the additional configuration section:
Github: Jellayy/grafana/pfSense Monitoring/telegraf.conf
## The URLs of the InfluxDB cluster nodes.
##
## Multiple URLs can be specified for a single cluster, only ONE of the
## urls will be written to each interval.
## urls exp: http://127.0.0.1:9999
urls = ["http://YOUR_SERVER:8086"]

## Token for authentication.
token = "YOUR_TOKEN"

## Organization is the name of the organization you wish to write to; must exist.
organization = "YOUR_ORGANIZATION"

## Destination bucket to write into.
bucket = "YOUR_BUCKET"
Now, head to your InfluxDB web ui and check the Data Explorer tab to see if telegraf is sending your data. (If you’re using InfluxDB2 and had to use the additional configuration method for connecting and aren’t seeing your data, make sure InfluxDB is deselected in the Telegraf config page by CTRL+Clicking the option)
Fixing Data Quirks
If you look at the “bytes_recv” and “bytes_sent” fields associated with an interface, you will notice that they are cumulative. To get these values in a more useful format (Mbps) use a DERIVATIVE() method in your query. You can also multiply your derivative function by 8 to convert from bytes/second to bits/second. I am personally using Grafana to manipulate my data like so:
Additionally, here is an example of how to solve the problem in your query:
SELECT DERIVATIVE("bytes_recv",1s)*8 FROM "firewall"."autogen"."net" WHERE time > :dashboardTime: AND "interface"='igb0'My Dashboard

Leave a Reply